
💡Ready to integrate AI into your team’s dbt workflows? We’re launching a brand new dbt with AI -course. Contact us to learn more!
1. Introduction
After a couple of years of having AI tools in the analytics engineering space, I wanted to understand what these tools are actually capable of today. Do they save time and effort, or are we still spending just as long reviewing and fixing AI-generated output?
In this blog post series I will try to integrate AI directly into the workflow of building dbt models and adding tests (Part 1), then building the semantic layer and connecting an AI client through MCP to ask natural language questions against the data (Part 2).
Part 1 covers the foundational work: setting up the project, building staging, intermediate and mart models with AI assistance, and implementing data tests.
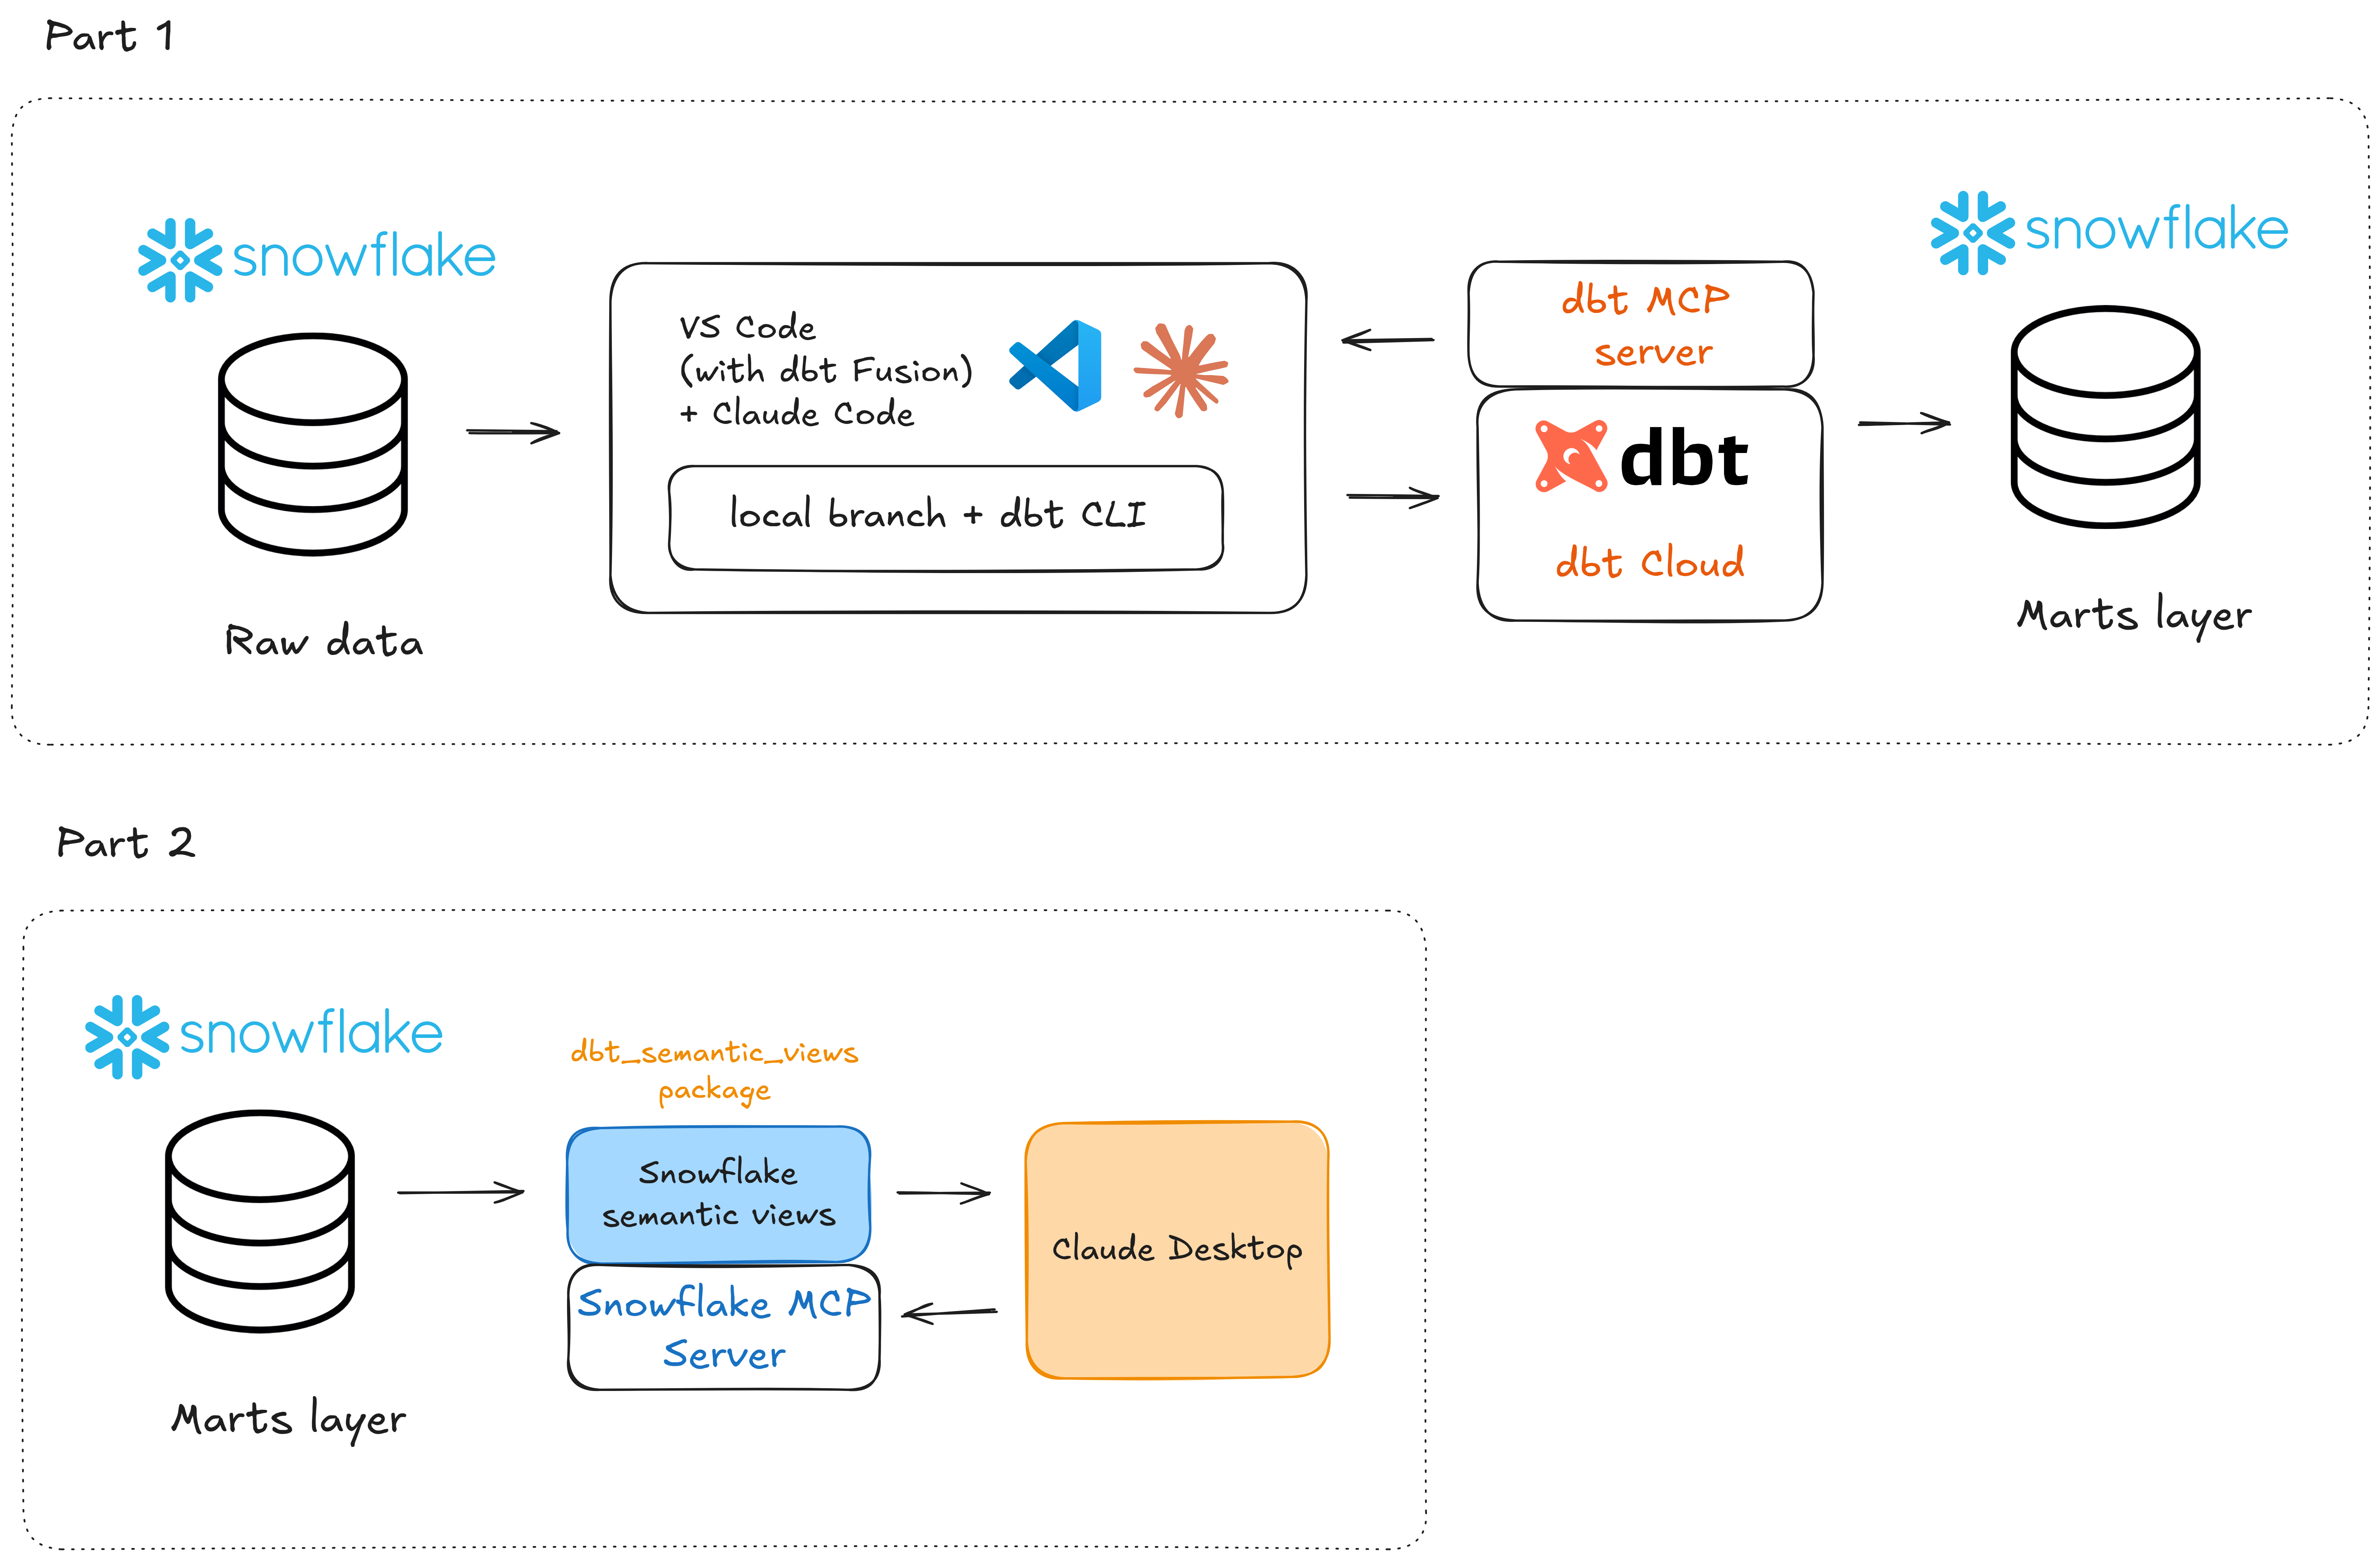
Part 2 will focus on the semantic layer and AI-powered querying: defining metrics in dbt, building the semantic layer and then connecting an AI client via MCP to enable natural language questions against the data. We will also be utilizing the brand new dbt_semantic_views package to build the Snowflake semantic views.
My full tool stack in this blog post series will be:
- Snowflake for data storage
- VS Code + Claude Code for local AI-driven development
- dbt CLI + dbt Cloud for running commands and building models
- dbt and Snowflake MCP servers to improve the context understanding for our AI tools
- dbt_semantic_views package to generate semantic views (Part 2)
- Claude Desktop to query the data in natural language (Part 2)
Here’s a simplified architecture diagram to visualize the flow of things:
2. Building dbt models with AI
Starting with an existing project
To keep things realistic, I'm not starting completely from scratch. In real life, the most typical scenario as an analytics engineer is that you’ll join an existing project and develop on top of its existing models. Hence I'll be working with an ecommerce dbt project that already has some models built in it.
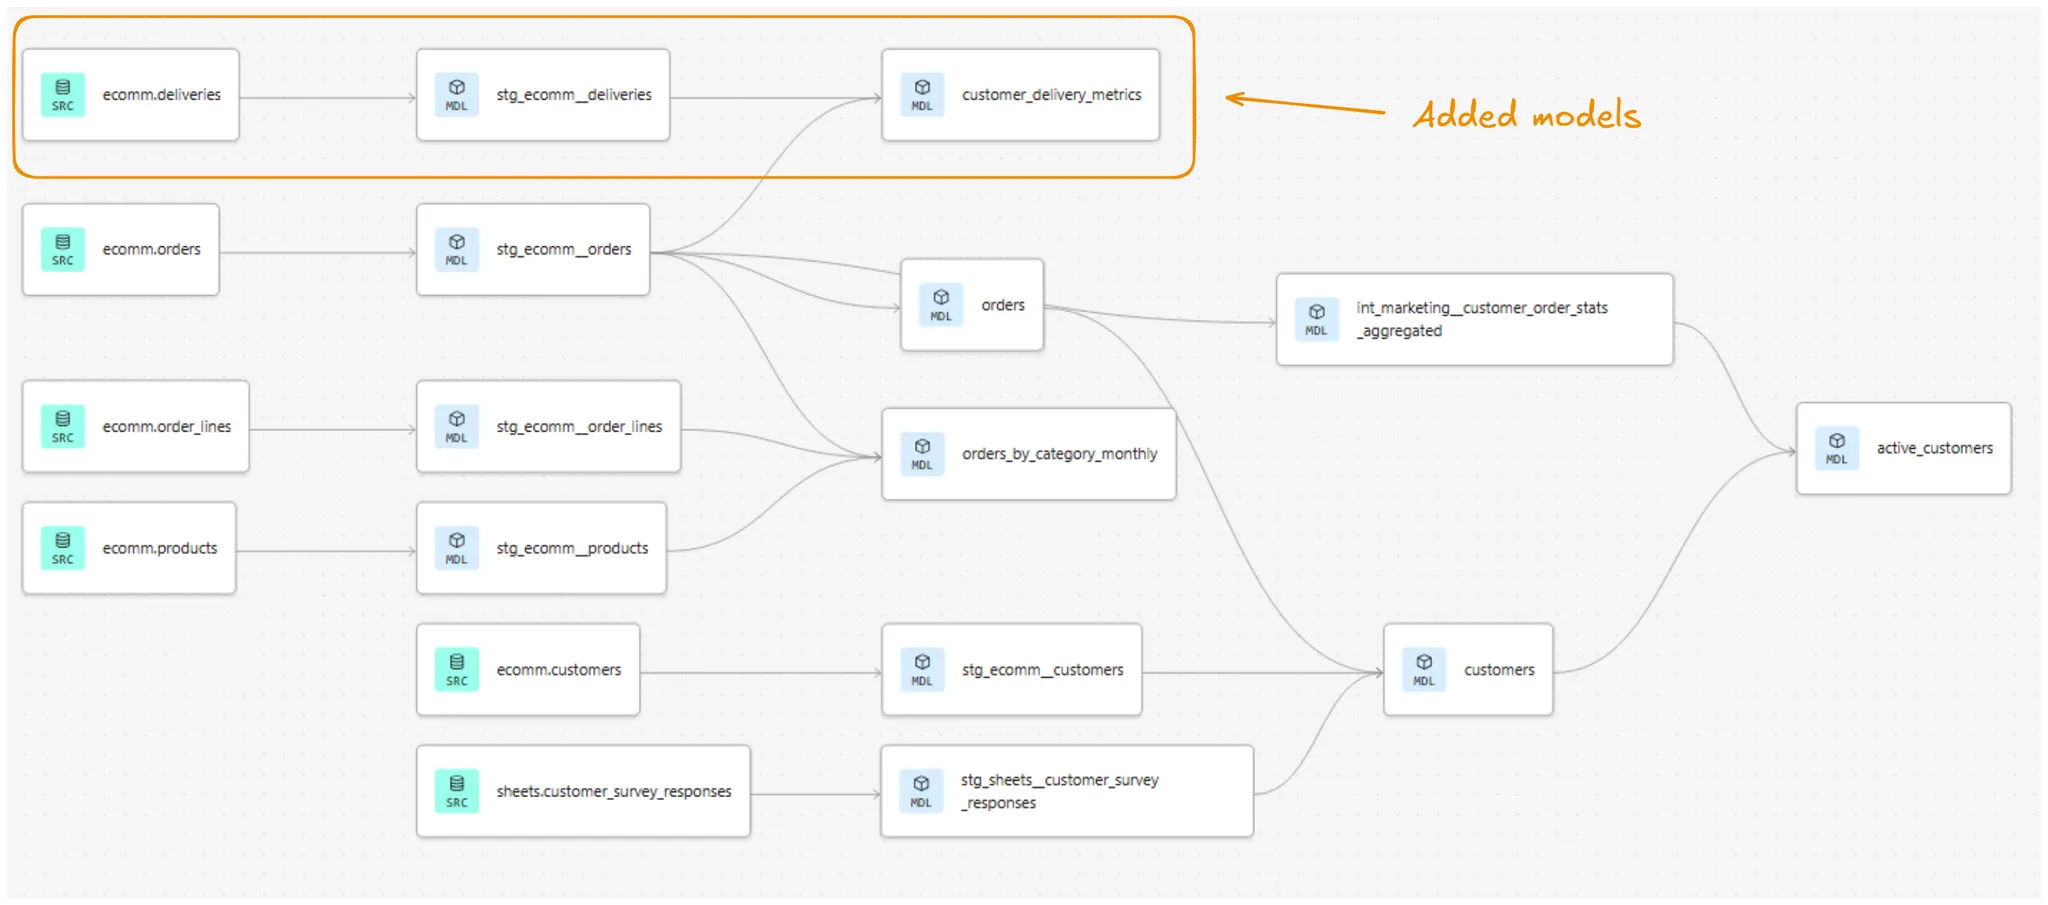
Below, you can see the existing lineage of the project. We already have a good view on customers and orders data, along with some aggregated metrics:
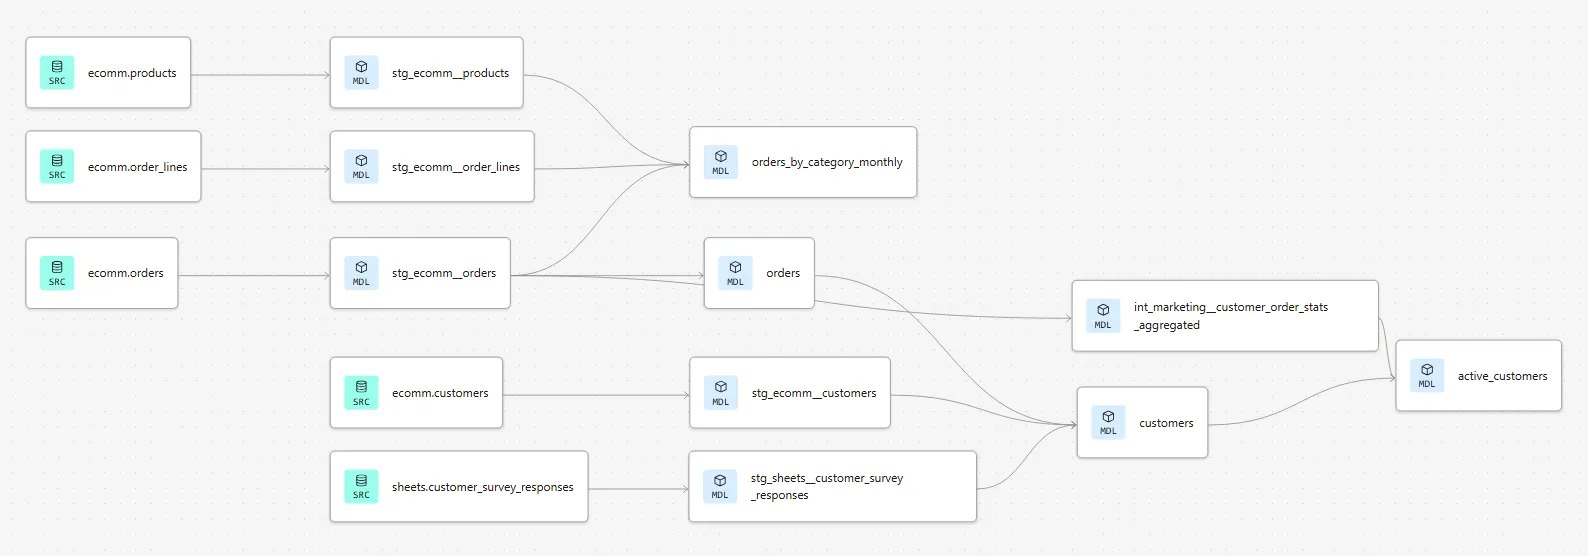
However, now the company logistics department wants to better start tracking their part of the business. So we need to bring in deliveries data as well as build some informative marts for them.
More specifically, the logistics department wants to see the following information on the marts layer:
- Customer ID
- Total delivery count
- Delivered delivery count
- Picked up delivery count
- Failed delivery count
- The timestamp of the last delivery
Setting up Claude Code and providing context
So how do we start?
First of all, let’s fire up Claude Code and make sure our project is properly setup there. As this is an existing project, it already has an established GitHub repository in place. All we have to do is start a new feature branch for the repo and clone it to our local machine with git clone:
git clone <https://github.com/Breakout-Labs/dbt-with-ai-blog-post>
Next, let’s make sure Claude Code has enough context to work with. Whenever we’re working with AI models and copilots, context is king. The more the model can see related context and instructions, the less it needs to guess. What follows is more accurate results.
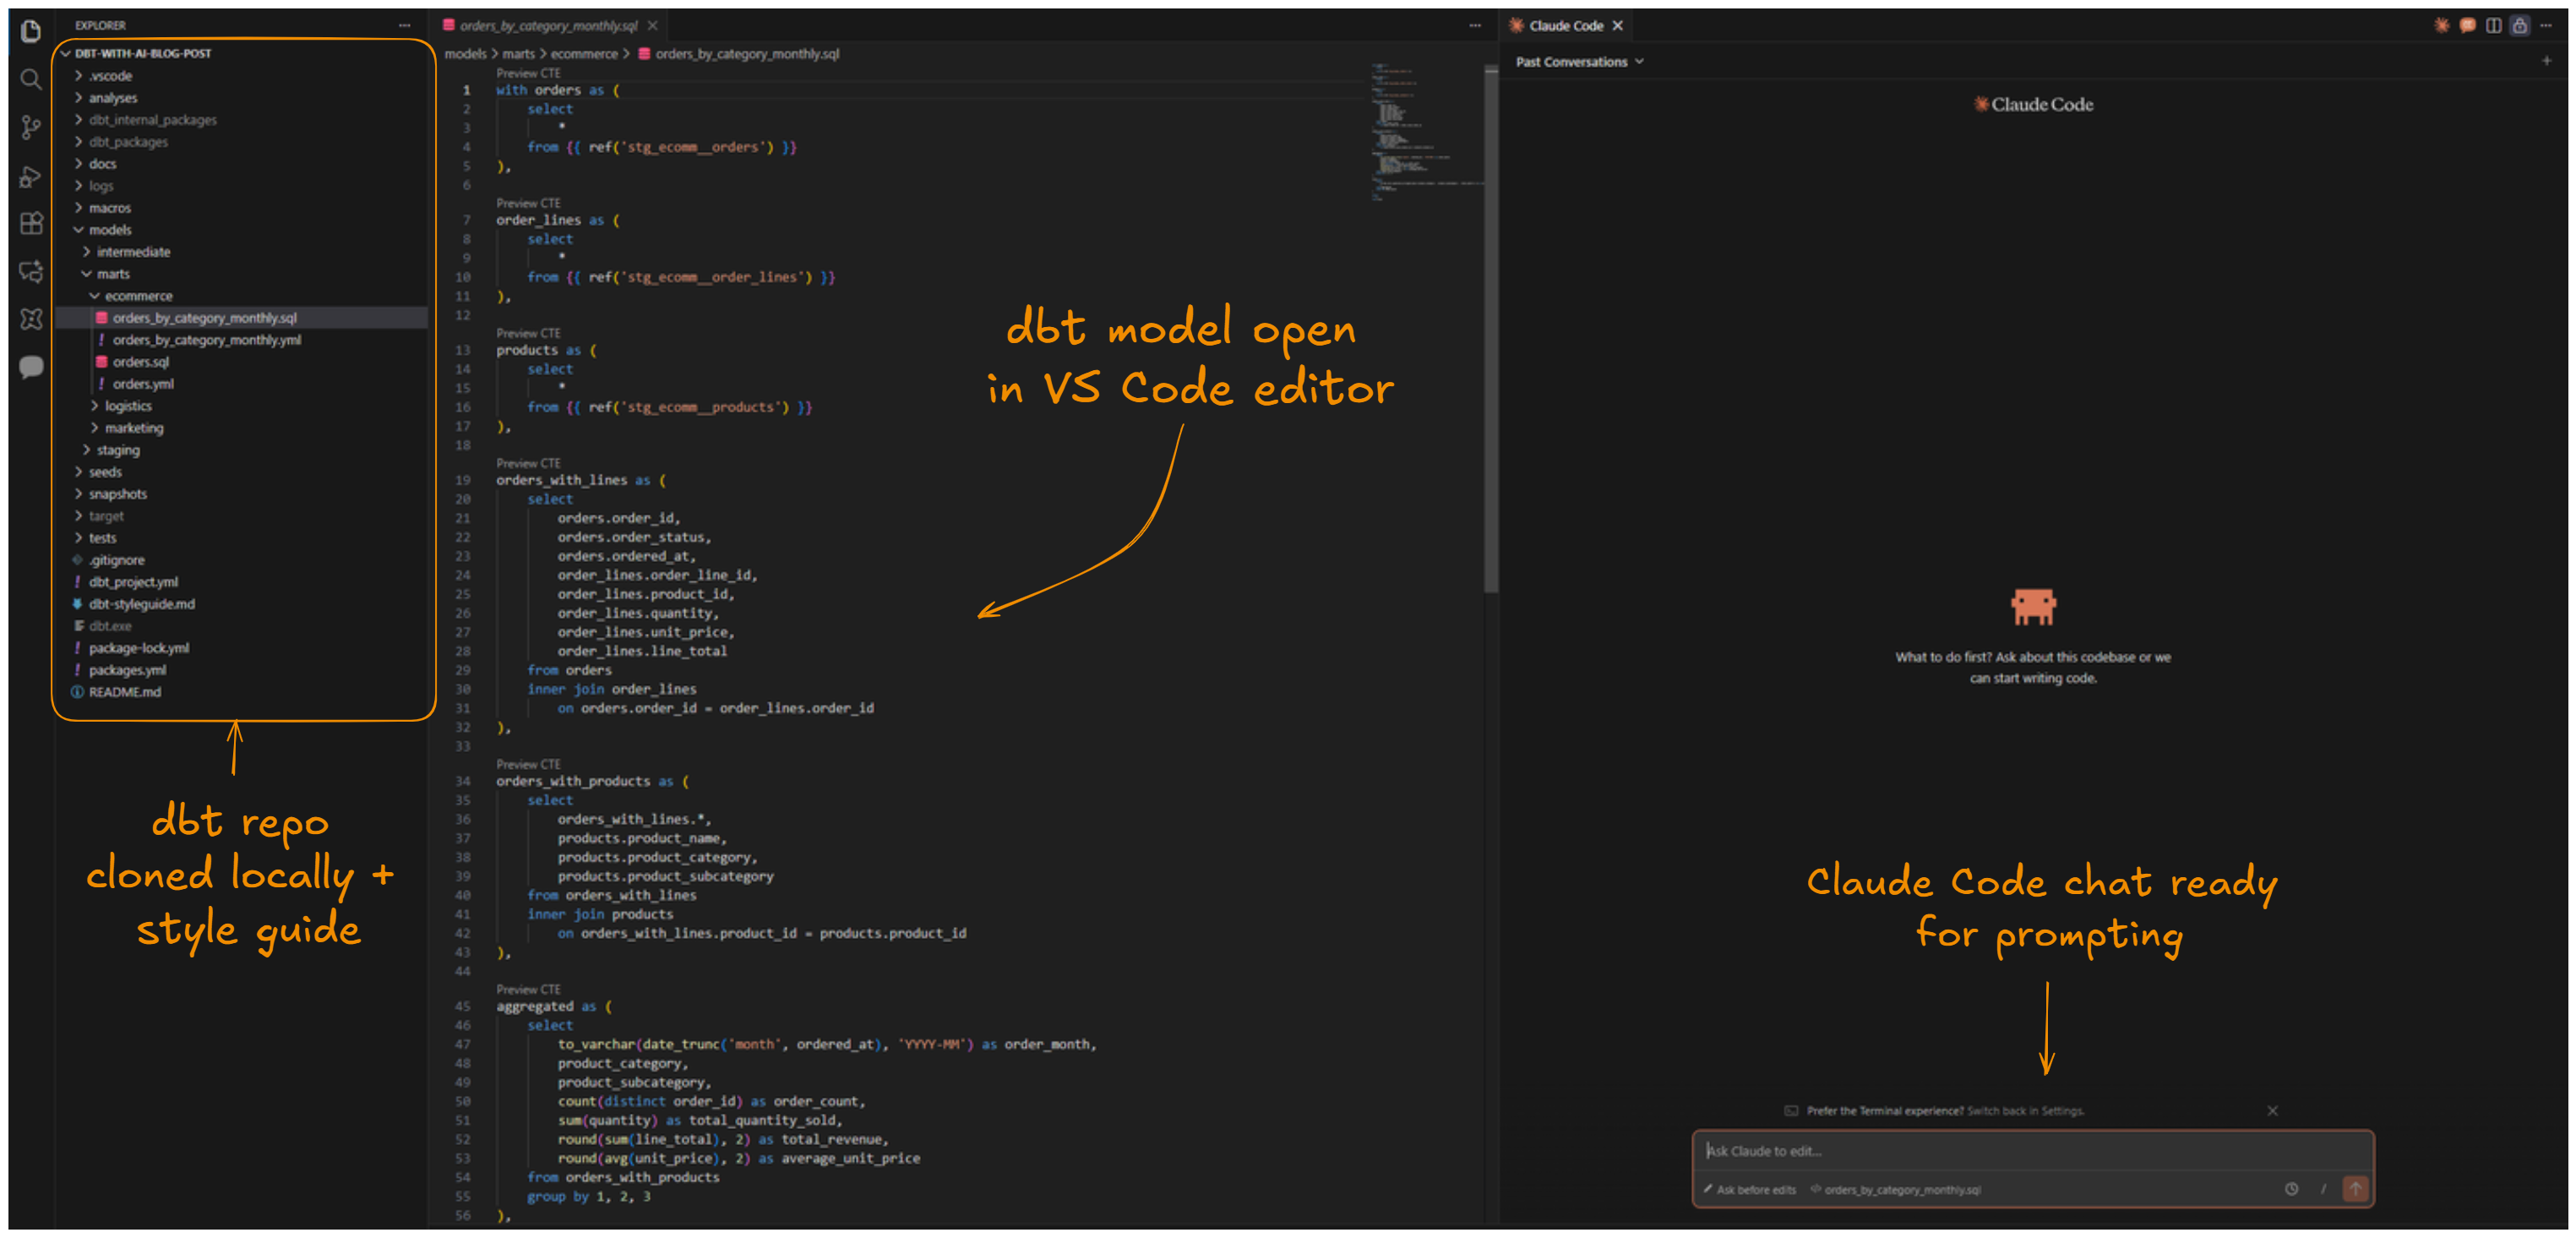
Since we have the project repo already cloned to our local machine, Claude Code can already see all of our existing dbt project files: SQL-models, YAML files et cetera.
To further improve Claude’s work, we will also hook up dbt Labs’ official style guide as additional context. The process is simple: we’ll just copy the contents of the markdown-file behind the url and create a new file in our project root called dbt-styleguide.md. The contents of the file can be adjusted to fit your project conventions.
At this point, our project setup looks like this:
Last but not least, we will enable a connection to the dbt Remote MCP Server. This will further improve the Claude Code’s understanding of the project context: it will know that this is actually a dbt project with models, data and a DAG, instead of a bunch of .sql and .yml-files in a project folder. More knowledge, less guess-work.
Most importantly, connecting to the dbt Remote MCP Server gives Claude Code access to predefined tools, such as fetching info about all models, lineage, exposure and so forth.
Prompting Claude to build the models
At this point, I think we’re ready to start building. Let’s hit Claude Code with an prompt of our intended goal:
Prompt:
- There's some deliveries source data defined in the _src_ecomm.yml.
- Please develop a staging model for deliveries inside the staging folder.
- Also develop a marts model in the marts folder that has the following output data:
- Customer ID, total delivery count, delivered delivery count, picked up delivery count,
failed delivery count, the timestamp of the last delivery
- For delivered deliveries, delivery_status = 'delivered'
- For picked up deliveries not yet delivered, delivery_status = 'picked_up'
- For failed deliveries, delivery_status = 'cancelled'
Claude Code will then plan its work and starting executing actions, like this:

Claude tends to be quite verbose when it’s generating the results. It’s probably good for debugging, but at times it can actually clutter the chat view and make it a bit hard to follow.
One nice thing about Claude’s workflow is that whenever it needs to run a command against dbt Cloud using the dbt CLI or create/edit a file, it will ask for permissions first. So the human will always give the final approval (unless you explicitly allow Claude to always perform these actions).
Reviewing the output and iterating
The whole process of completing the models took around 2-3 minutes. Let’s review how Claude performed this task.
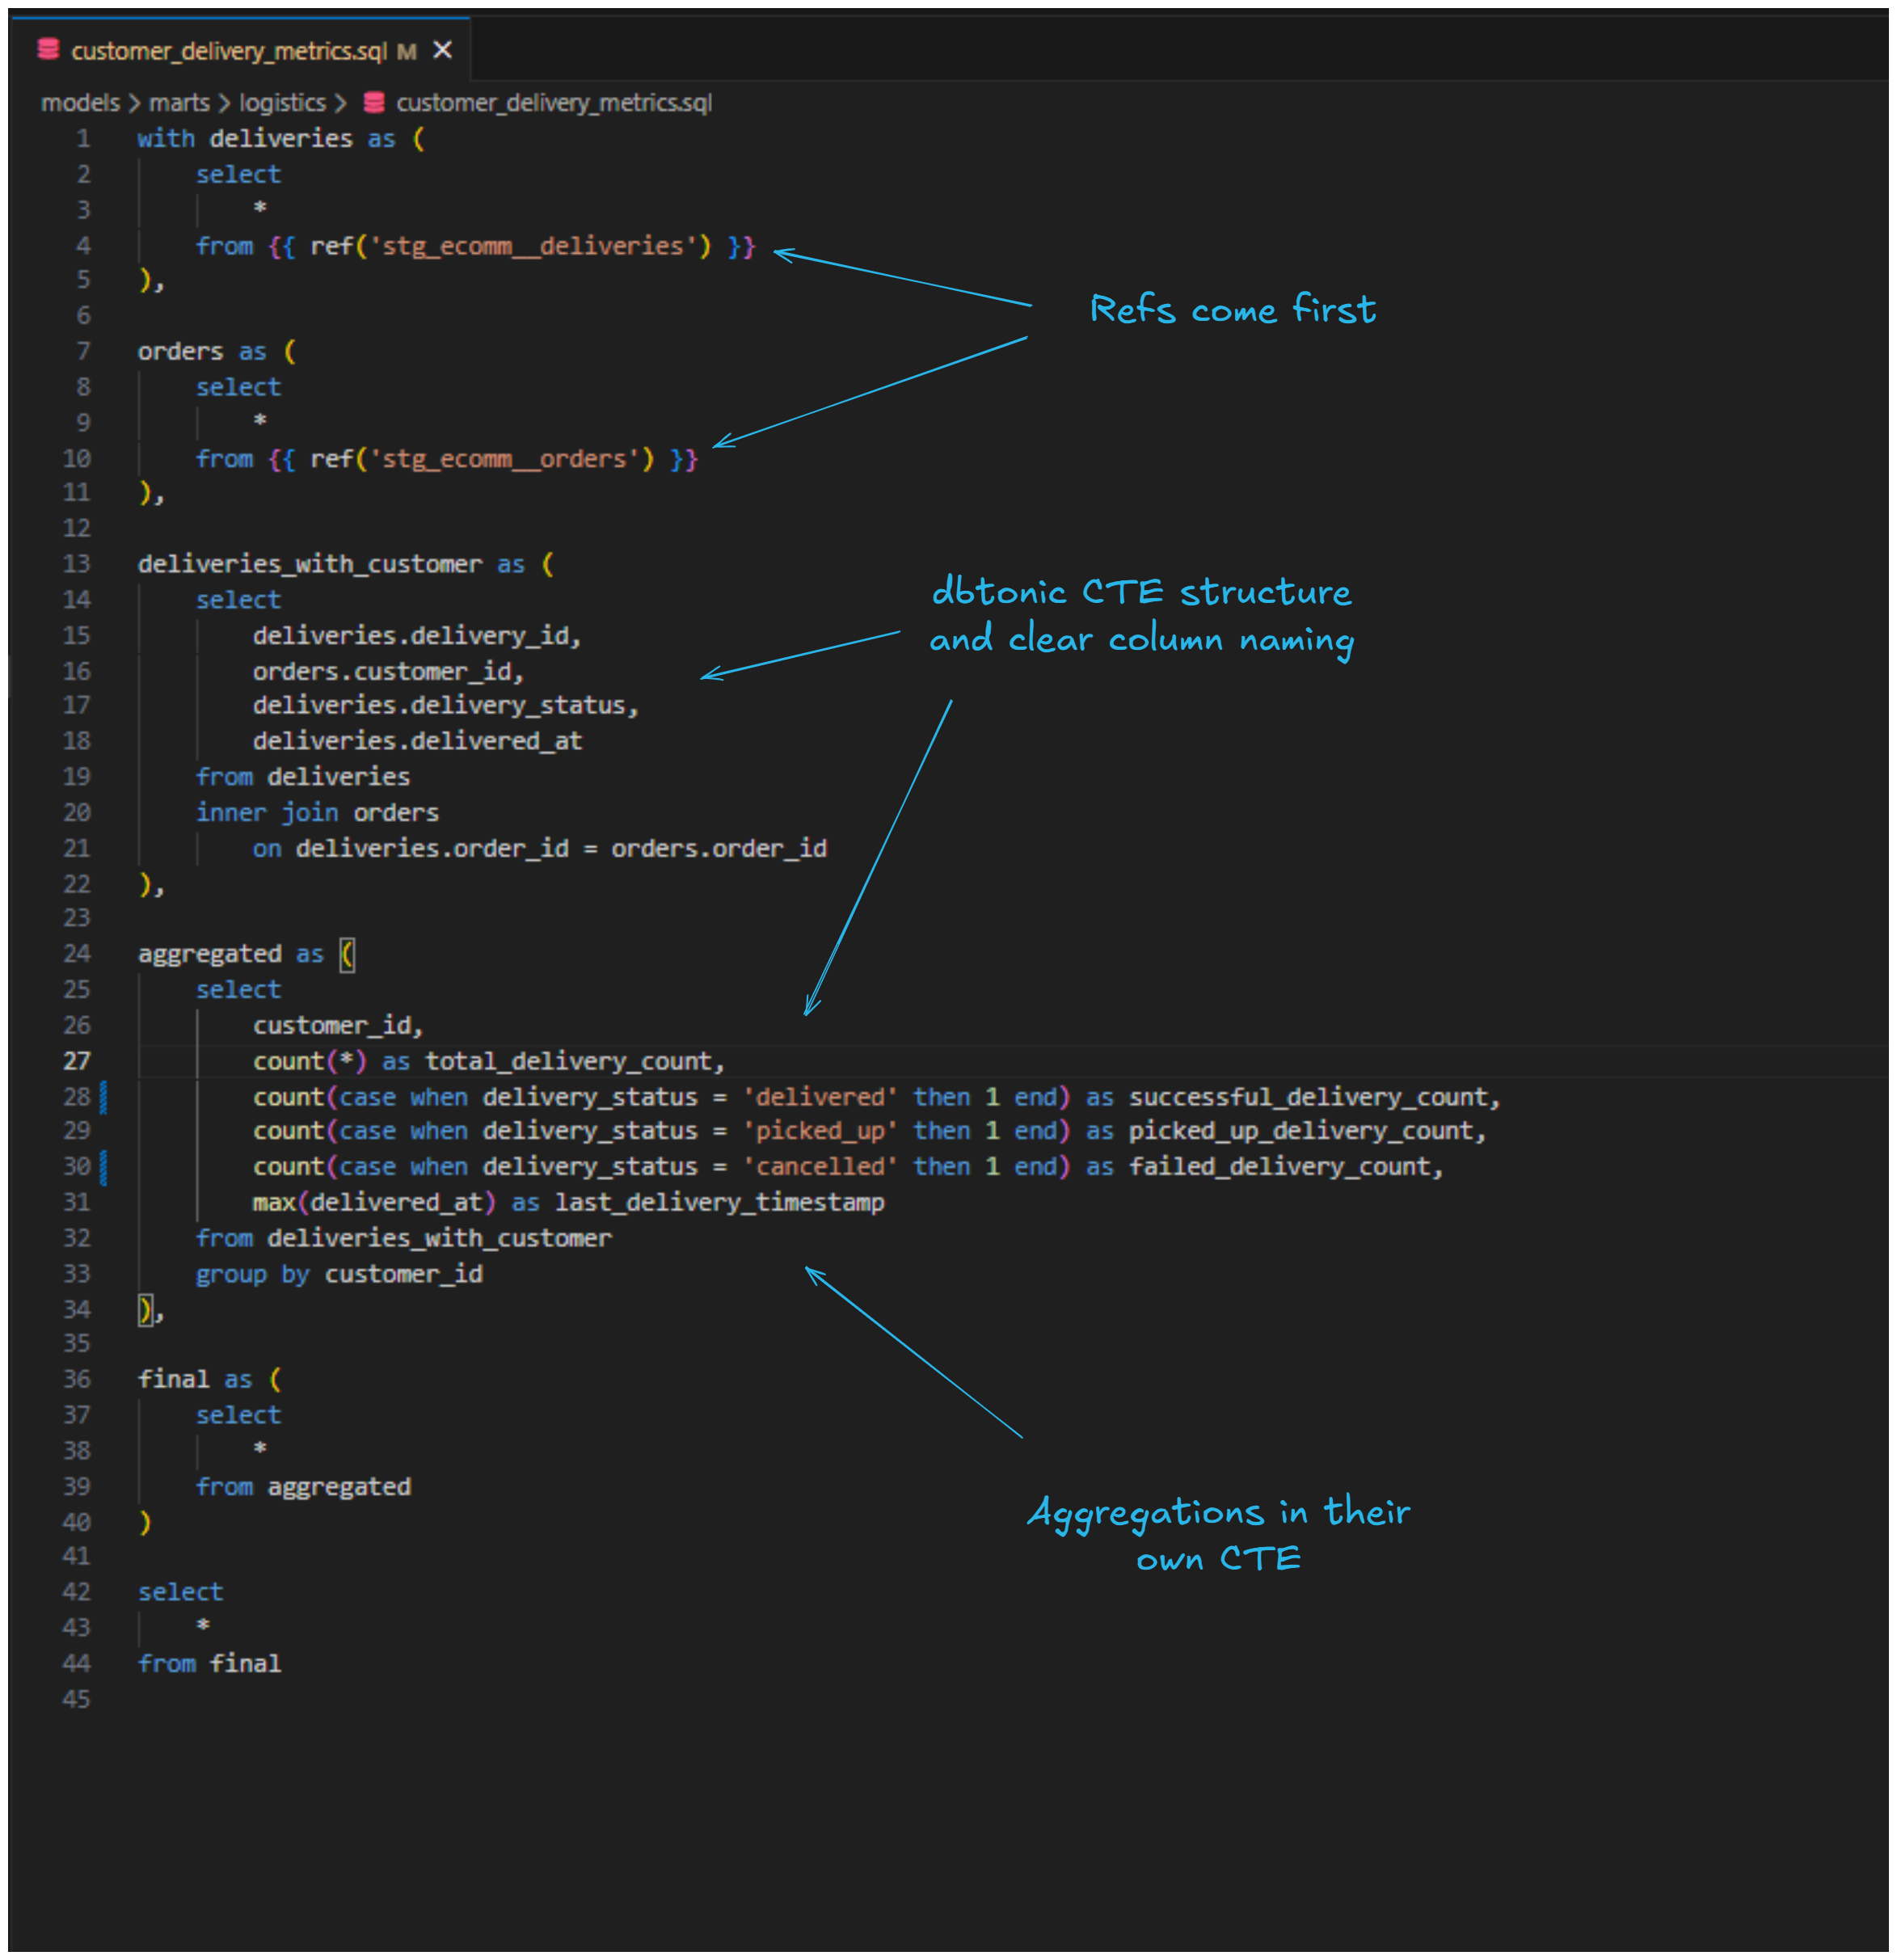
Both of the created models seem to follow the "dbtonic" style of SQL, with CTEs clearly separating each logical step of the transformation. They also use source and ref macros to reference sources and upstream models, fully qualified column names in joins, and performing aggregations in a dedicated CTE. Field naming is descriptive and the code uses lowercase keywords, trailing commas, and four-space indentation throughout. So not bad at all!
But how does the actual data look like? With dbt CLI we can easily preview the results directly on the command line. Let’s review the marts model with dbt show -s customer_delivery_metrics.sql :
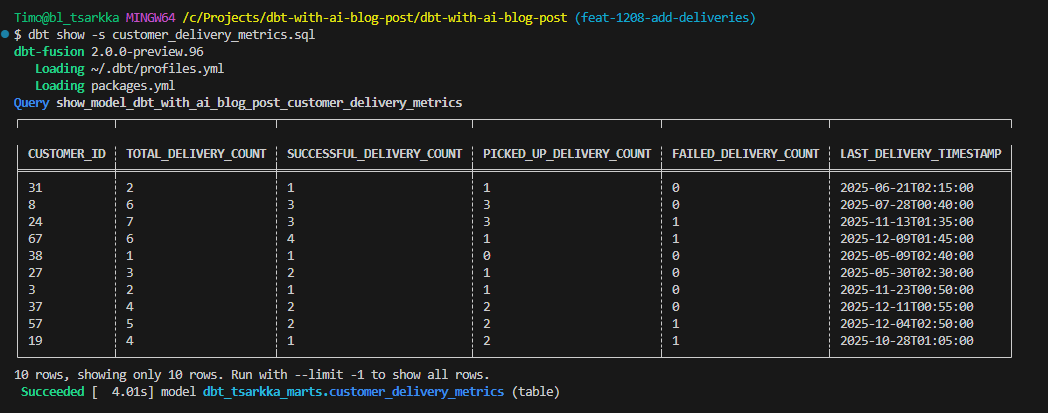
The results look promising. The total delivery count matches the sum of the different delivery type statuses and the timestamps are there.
One thing I do want to correct though is the naming/order of the columns. Since picked up deliveries can also end up as successful deliveries eventually, I want to make this clear in the naming. Also, I want the column names to better reflect the actual statuses:
Prompt:
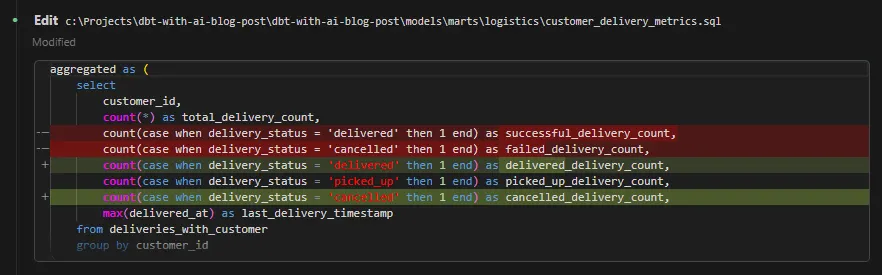
- Can you rename the delivery status columns to 'delivered_delivery_count', 'picked_up_delivery_count and
'cancelled_delivery_count' and also reorder respectively?
This is an easy task, so Claude carried it in a straightforward manner. It’s also nice that it displays the diffs after the edits:
Building and validating in Snowflake
Now that everything seems to be in order on the dbtside, let’s build the models with dbt build -s +customer_delivery_metrics and ensure everything gets correctly materialized in Snowflake:
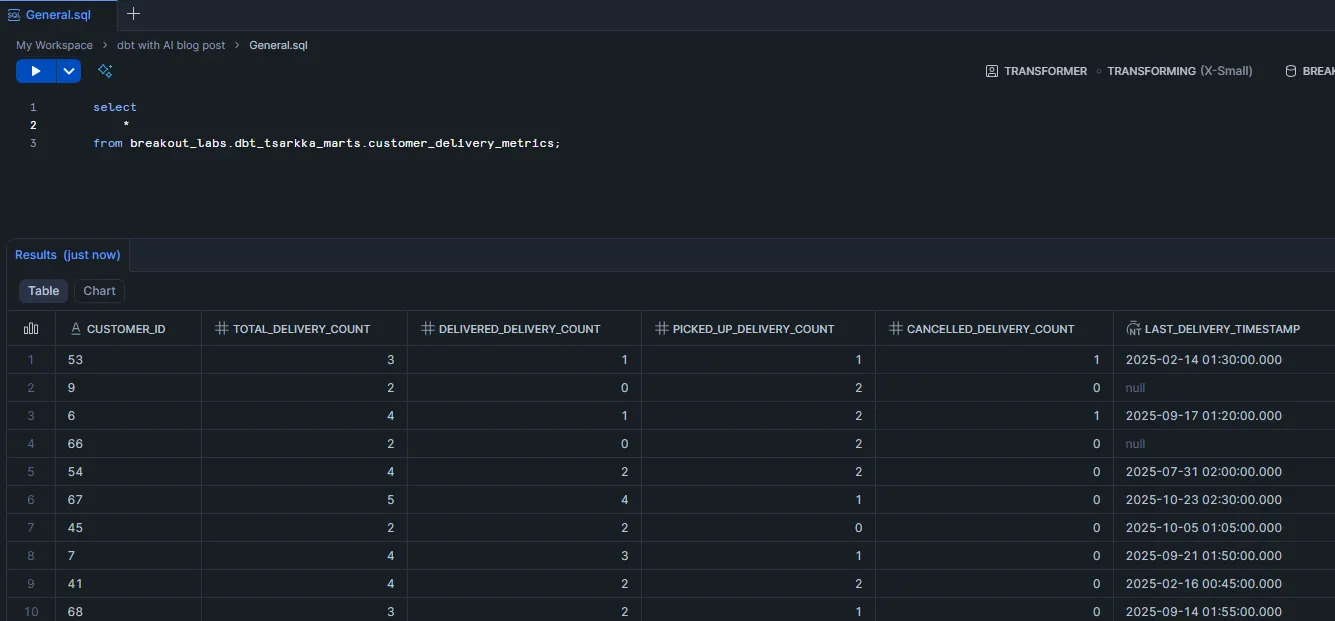
We can also do our first quick data validation here. As you might guess, the total delivery count should match the sum of the different delivery status types. If it doesn’t, we know that something is off. So let’s run the following query against the mart:
select
	*
from breakout_labs.dbt_tsarkka_marts.customer_delivery_metrics
where total_delivery_count <>
(delivered_delivery_count + picked_up_delivery_count + cancelled_delivery_count)
We don’t get any results from this query, so the data looks to be correct.
Finally, before closing off this part, let’s take a look at our project’s lineage after adding the new models:
3. Building tests and monitoring with AI
Now that we have our models in place, it's time to add some guardrails. Testing is one of those things that every analytics engineer knows they should do more of but that is kind of boring to implement. This is where AI can really shine. It's great at generating the repetitive but necessary code that makes up most of our tests.
For our new logistics models, we want to ensure the following:
- Primary keys are actually unique
- Our delivery status logic is working correctly
- Count fields don't go negative
Generating comprehensive tests with AI
Ok, so let’s get started. This is the prompt we’ll be using to build the tests. We’ll use this opportunity to also document the models at the same time:
Prompt:
- Please generate dbt data tests for the stg_ecomm__deliveries and customer_delivery_metrics
models in the appropriate .yml-files-
- Make sure to test primary key uniqueness and not null constraints
- Also add other business logic tests, as appropriate
- Use external packages, like dbt_utils (or other ones), if it makes sense
- Also generate documentation in the same .yml-files
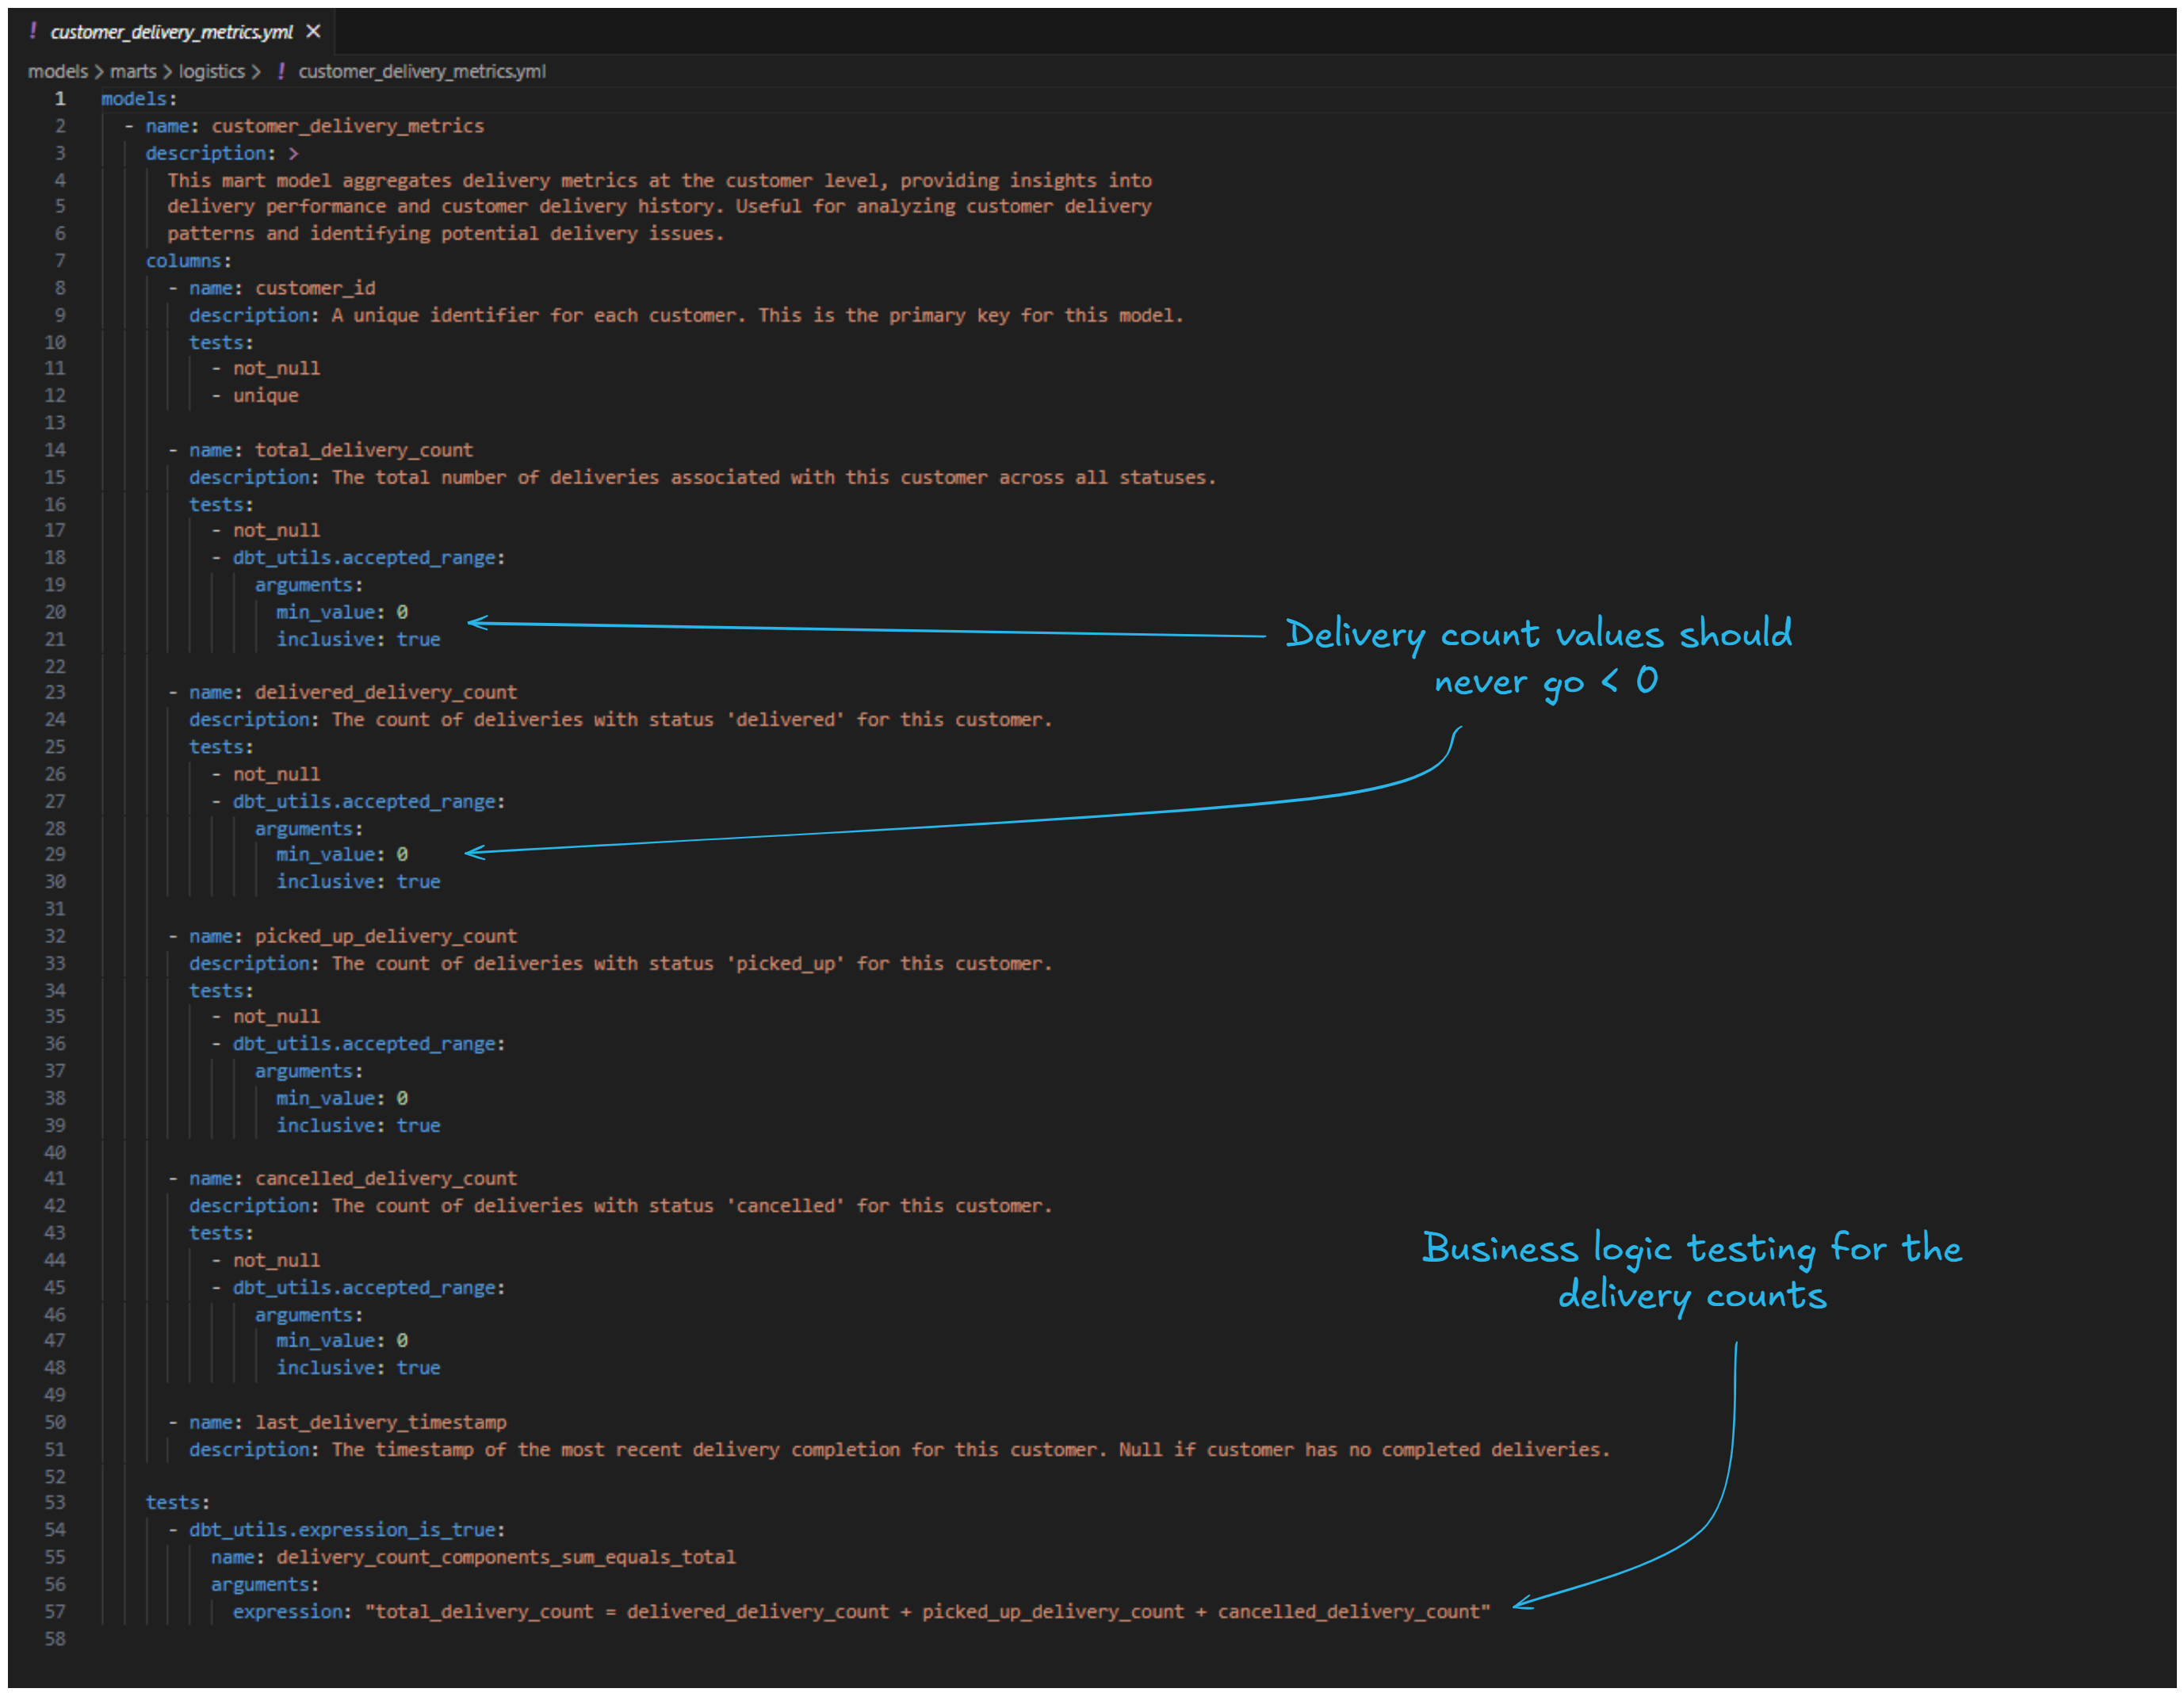
Again after about 2-3 minutes, Claude has finished its work and we can review the generated .yml-files. For the marts model, Claude has generated unique and not_null tests for most columns, but also min_value: 0 for the numeric columns. The business logic tests include the singular validation we already did earlier: the total delivery count should equal the sum of the different delivery statuses count.
It's always good to critically evaluate the amount and type of tests needed. We shouldn't be adding tests just for the sake of testing. Tests consume compute and in the end also cost money. For this case, we're happy with what we have and can proceed.
Running the tests
Finally, let's run our tests to make sure everything passes:
dbt test -s +customer_delivery_metrics
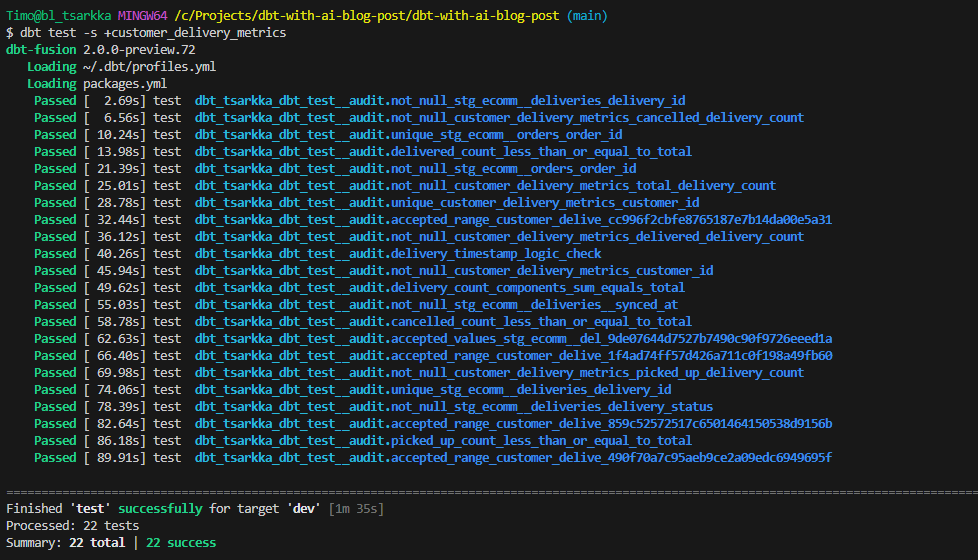
All green! This gives us confidence that our models are working as expected and will continue to work as the underlying data changes.
4. Conclusion
Let’s take a step back and see what we learnt from this experiment.
Overall, I think the AI-enhanced analytics engineering developer experience is definitely here to stay. We created two new dbt models, tests and documentation in less than 10 minutes, with another 10-15 minutes for reviewing everything. In less than half-hour, we did work that otherwise could have taken at least some 1-2 hours, most of it generating repetitive code for tests and documentation.
The overall development flow feels quite smooth already, once you get everything setup (although that can take some time to achieve). Developing with Claude feels natural and chatting to it is very human-like. At this point it would feel already like a huge loss in productivity to not have access to this toolset.
Some other key takeaways:
- AI excels at writing dbtonic SQL, Jinja and docs. Perhaps obvious, but for example Claude Code has gotten really good at writing solid code and doing long tasks almost fully independently. They still get sidetracked or mess up at a bit at times, but this happens quite seldomly anymore. In addition, AI shines doing the more “boring” repetitive stuff, like yaml-definitions and documentation where you could easily spend a lot of time just typing and indenting text files.
- Context is still king. The more you can instruct and help the AI see things around you and the codebase, the better. Always connect it to your repo, style guides, dbt MCP server. Less guessing, better outputs.
- Devs will become more like architects. Less direct writing of SQL or Jinja, more designing the solution, deciding what's worth building, and steering the ship. And of course more reviewing. In the end though, the human is still the one responsible, so you need to know what the code does.
- Expansion of possibilities. Now that we're not bottlenecked by our ability to produce code, what kind of possibilities does it open up? What can you try out or build that wasn't feasible earlier because you didn't have time?
- Analytics engineering is evolving rapidly. If one thing is for sure, analytics engineering in 2030 will look very different from 2025. The time to adapt is now.
That wraps it up! In Part 2 of the series, we'll take things even further by building out the semantic layer and connecting an AI client via MCP to query our data with natural language. Stay tuned!
💡Ready to integrate AI into your team’s dbt workflows? We’re launching a brand new dbt with AI -course. Contact us to learn more!